Event-Driven Python on AWS - #CloudGuruChallege
Automate an ETL processing pipeline for COVID-19 data using Python and cloud services.

Technical Consultant
Overview
I came across this challenge couple of weeks ago after completing The Cloud Resume Challenge. The goal of this challenge is to automate an extract, transform and load (ETL) processing pipeline for COVID-19 data using python. Datasets used in completing the main challenge come from Johns Hopkins (JH) as well as The New York Times (NYT) so it's not just a one horse race! Forrest created and posted both challenges publicly so anyone can take advantage!
In total, there are 12 main steps to this challenge, but I have summarized my approach with the six points below.
1. Trigger
Amazon EventBridge handles the triggering for my whole workflow. Eventbridge is a serverless event bus service that you can use to connect your applications with data from an array of sources. I created a rule that would trigger my Lambda function every day at 10 AM, but EventBridge could also be set up to run in response to an event. If you're interested in using EventBridge, here's a good resource getting started.
2. Extract, Transform, Load (ETL)
◆ Extract
In the extract phase, I was tasked with downloading both datasets from The New York Times and Johns Hopkins GitHub repositories using Python. To do this, I used the pandas library to perform this operation and load both datasets into memory.
# Source URLs
jh_url = "https://raw.githubusercontent.com/datasets/covid-19/master/data/time-series-19-covid-combined.csv"
nyt_url = "https://raw.githubusercontent.com/nytimes/covid-19-data/master/us.csv"

# Read links and load data to pandas DataFrame
jh_df = pd.read_csv(jh_url, parse_dates=["Date"])
nyt_df = pd.read_csv(nyt_url, parse_dates=["date"])
By using the parse_dates argument, I was able to convert date strings into datetime objects. This way, my code recognizes dates as actual dates instead of random strings. Consequently, this makes transformation much simpler.
◆ Transform
The transformation phase is essential to ensure the data we collected from both New York Times and Johns Hopkins are standardized. As you remember, we extracted datasets from two sources - NYT and JH. The data gathered from NYT included number of cases and deaths in the US only, whereas JH's dataset had case, death, and recovery numbers for not just the United States but other countries as well.
I joined the JH and NYT datasets so that I would only be left with data relevant to the US. We are instructed to treat NYT data as superior, so after joining the two sets of data, I am left with cases/death from NYT and recoveries from JH.
def transform(NYT, JH):
    # Filter Johns Hopkins data to get US only and convert recoveries from string to int
    us_only = JH[JH['Country/Region'] == 'US']
    us_only = us_only.astype({'Recovered': 'int64'})

    # Convert column headers to lowercase
    us_only.columns = us_only.columns.str.lower()

    # Merge NYT data with recovery numbers from Johns Hopkins
    trans = NYT.merge(us_only[['date', 'recovered']], on='date', how='inner')
    new_columns = ['date', 'cases', 'recovered', 'deaths']
    trans = trans[new_columns]

    return trans
The challenge requires that the transformation code must be written in a Python module. I wrote the module to meet this requirement.
◆ Load
The data, once transformed, must go somewhere. You can choose to store it in DynamoDB or RDS Postgres. I went with the storage option of RDS Postgres because I wanted some practice using it--but really, you can't go wrong either way.
The sqlalchemy toolkit and psycopg2 adapter helped me create and interact with my RDS table, while PGAdmin was used to manage the Postgres database. PGAdmin is a popular open-source GUI tool for handling PostgreSQL databases.
 # Connection string for sqlalchemy with parameters
    db_uri = f'postgresql+psycopg2://{db_user}:{db_passwd}@{db_host}:{db_port}/{db_name}'
    engine = create_engine(db_uri, echo=True)

# Attempt to read DB table and create it if one does not exist
    try:
        table_data = pd.read_sql_table(table_name=table, con=engine)
        merged = table_data.merge(new_data, how='outer', indicator=True)
        merged_diff = merged.loc[lambda x: x['_merge'] == 'right_only']

        loadToDB = merged_diff.drop('_merge', axis=1)  # Drop merge column

        # Append difference in data to DB table
        data_to_sql(action='append', df=loadToDB)  # If table exists, append new transformed data
        message(loadToDB)
    except ValueError:
        data_to_sql(action='replace', df=new_data)
        message(new_data)
The first time you load data into the database, it should include your entire historical dataset. For all subsequent loads, only the new data that isn't already in the database needs to be imported. I dealt with this by using a try-except block, as shown above.
Some of the libraries used in writing my Python code are not readily available in Lambda. I had to create a Lambda layer to enable me to utilize these libraries. I might write an article about creating Lambda layers at a later time.
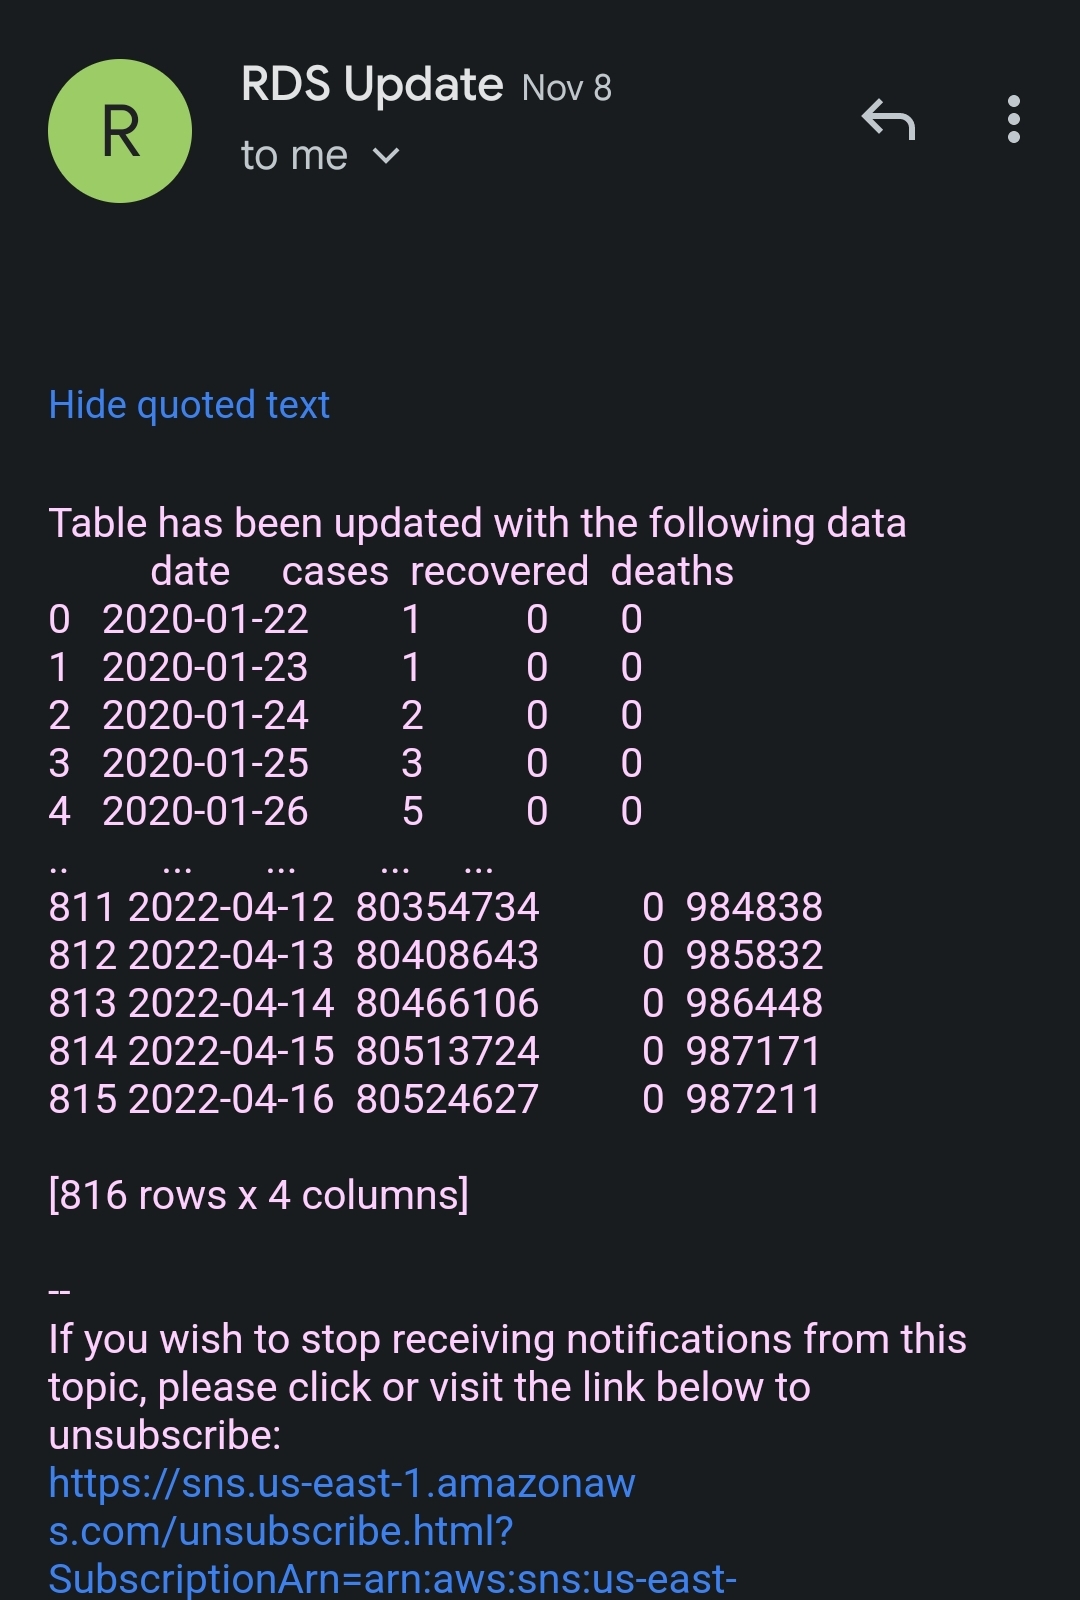
3. Notifications
I utilized Amazon Simple Notification Service (SNS) to send alerts each time the database is updated, so that people interested in this report would be notified.
# Publish to SNS topic
def message(content):
    sns.publish(
        TopicArn=f'{ARN}',
        Subject=f'ETL Pipeline Table Update - {dt.date.today()}',
        Message=f'Table has been updated with the following data\n{content}'
    )
The alert includes the date and what data was added to the table. The initial load of 800 rows caused the message to get truncated; however, I have not had that problem since then because it is typically only a couple of rows being updated daily.
4. Infrastructure as Code (IaC)
For this task, I utilized Terraform. And since most of my resources were already created through the console, terraform import helped me bring them under Terraform management. If you're more interested in CloudFormation or any other tool, by all means go ahead and use that instead. However, for those who want to see the code used for this project, I will be making the GitHub repository public here.
5. CI/CD Pipeline
Although this step is optional, I have chosen not to do it because I don't plan on continuing running or making updates to the app. If you do choose to set up a pipeline, here's an idea of what it could look like.
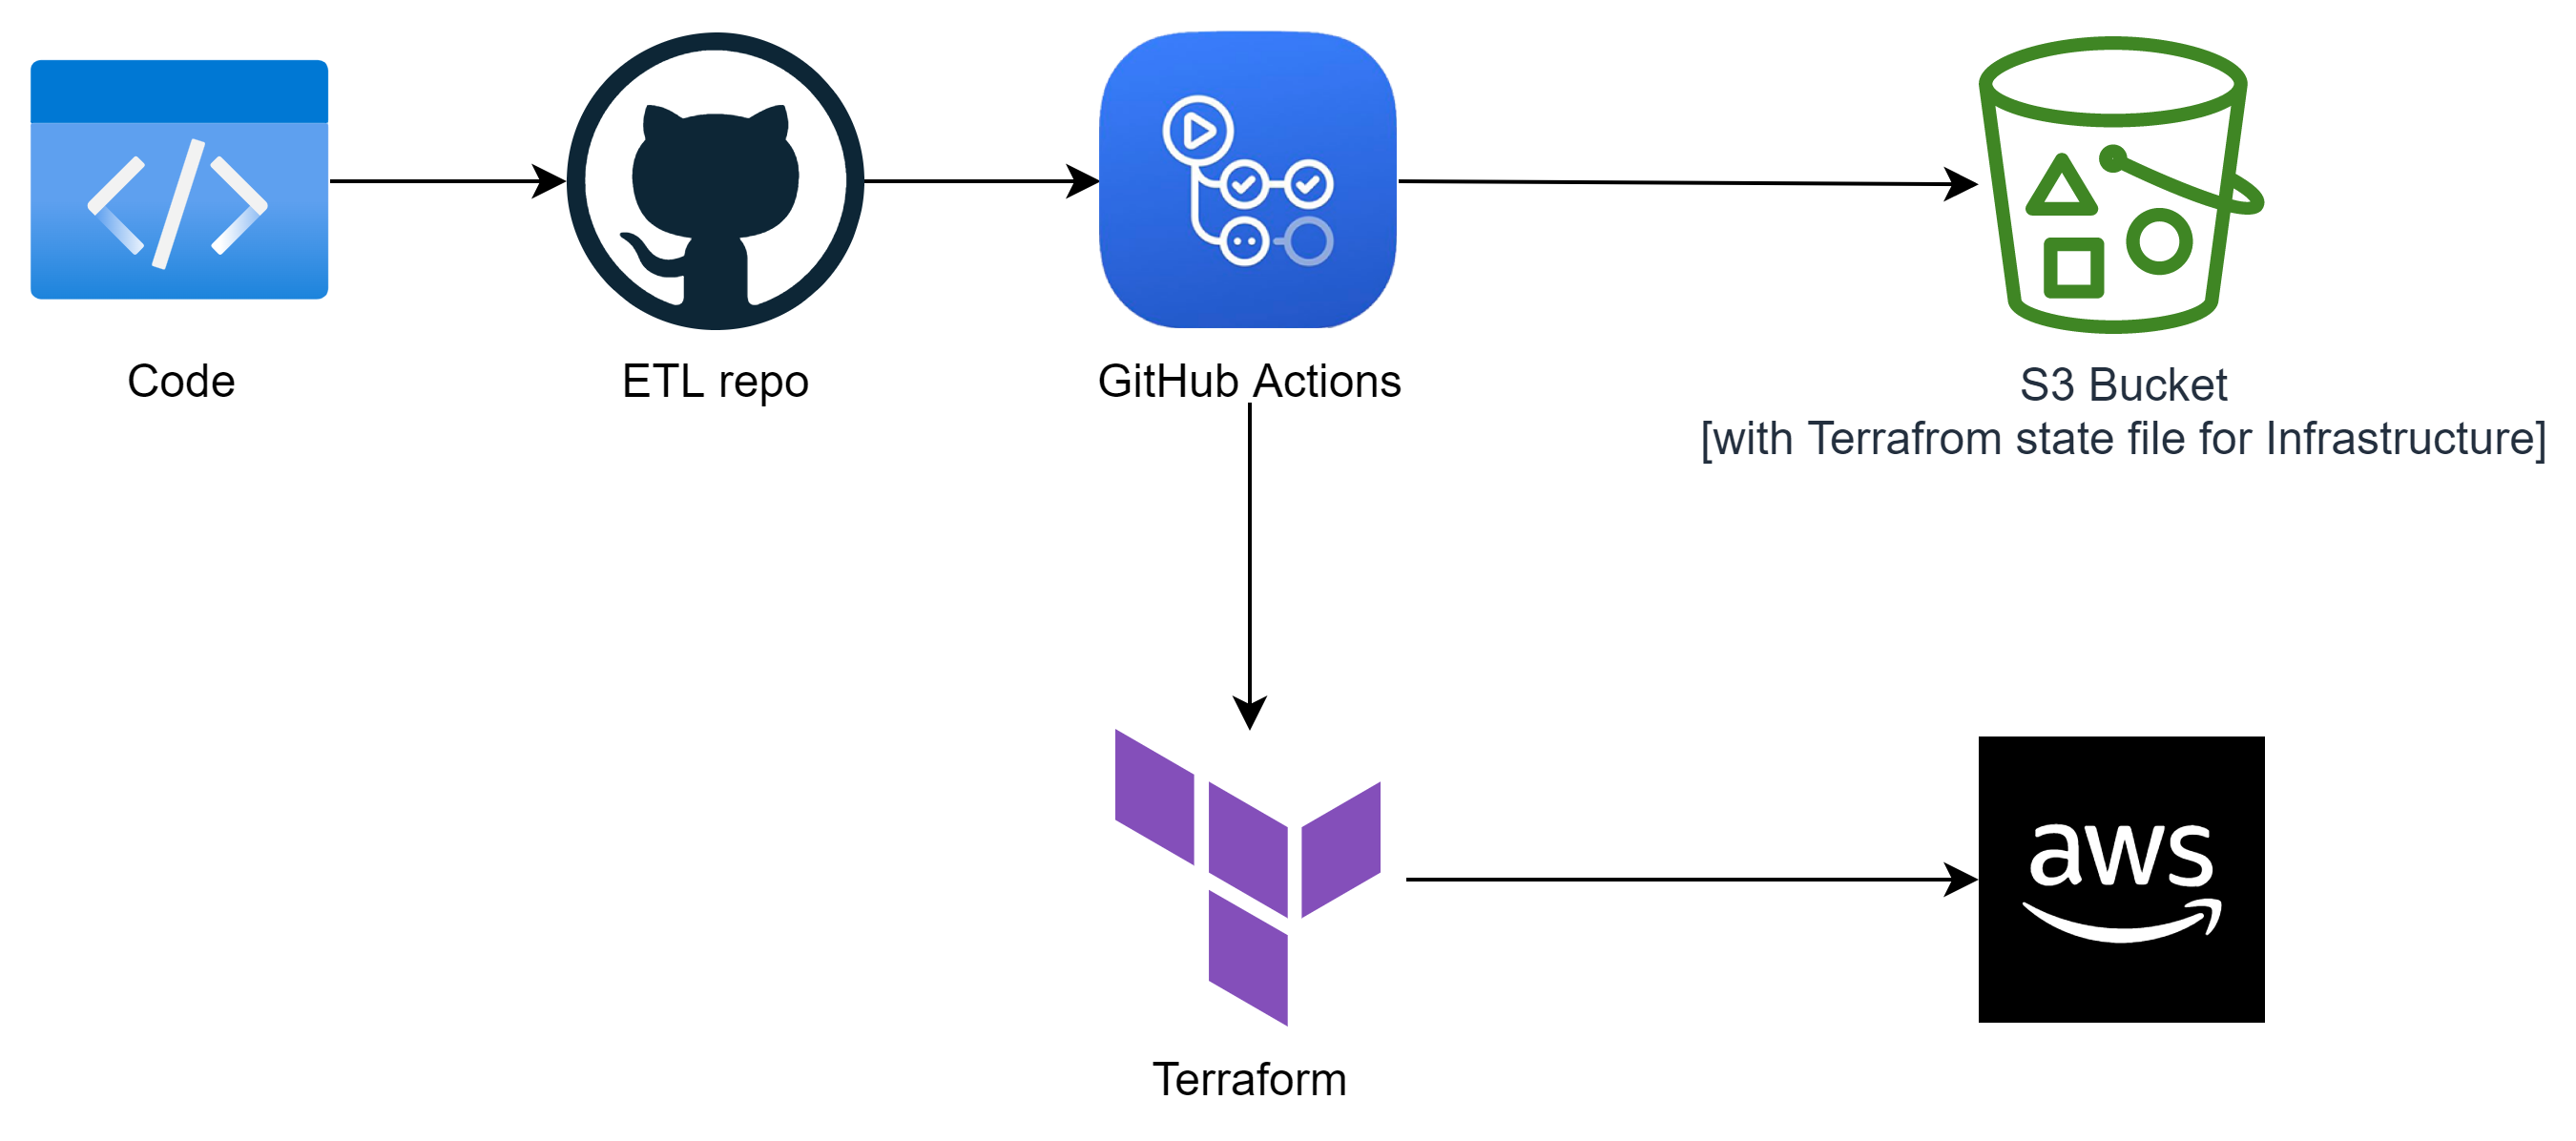
Follow this link to get started with GitHub Actions- it's easy, I promise!
6. PowerBI Dashboard
The last task was to connect the database with a BI service. QuickSight was my first choice, but I found it difficult to use and aesthetically unappealing. In the end, I went with Microsoft PowerBI instead.
I found it more complicated than expected to connect the database to PowerBI. I encountered a specific error which unfortunately I cannot recall at the moment. However, this thread from the online PowerBI community was beneficial in resolving the issue.
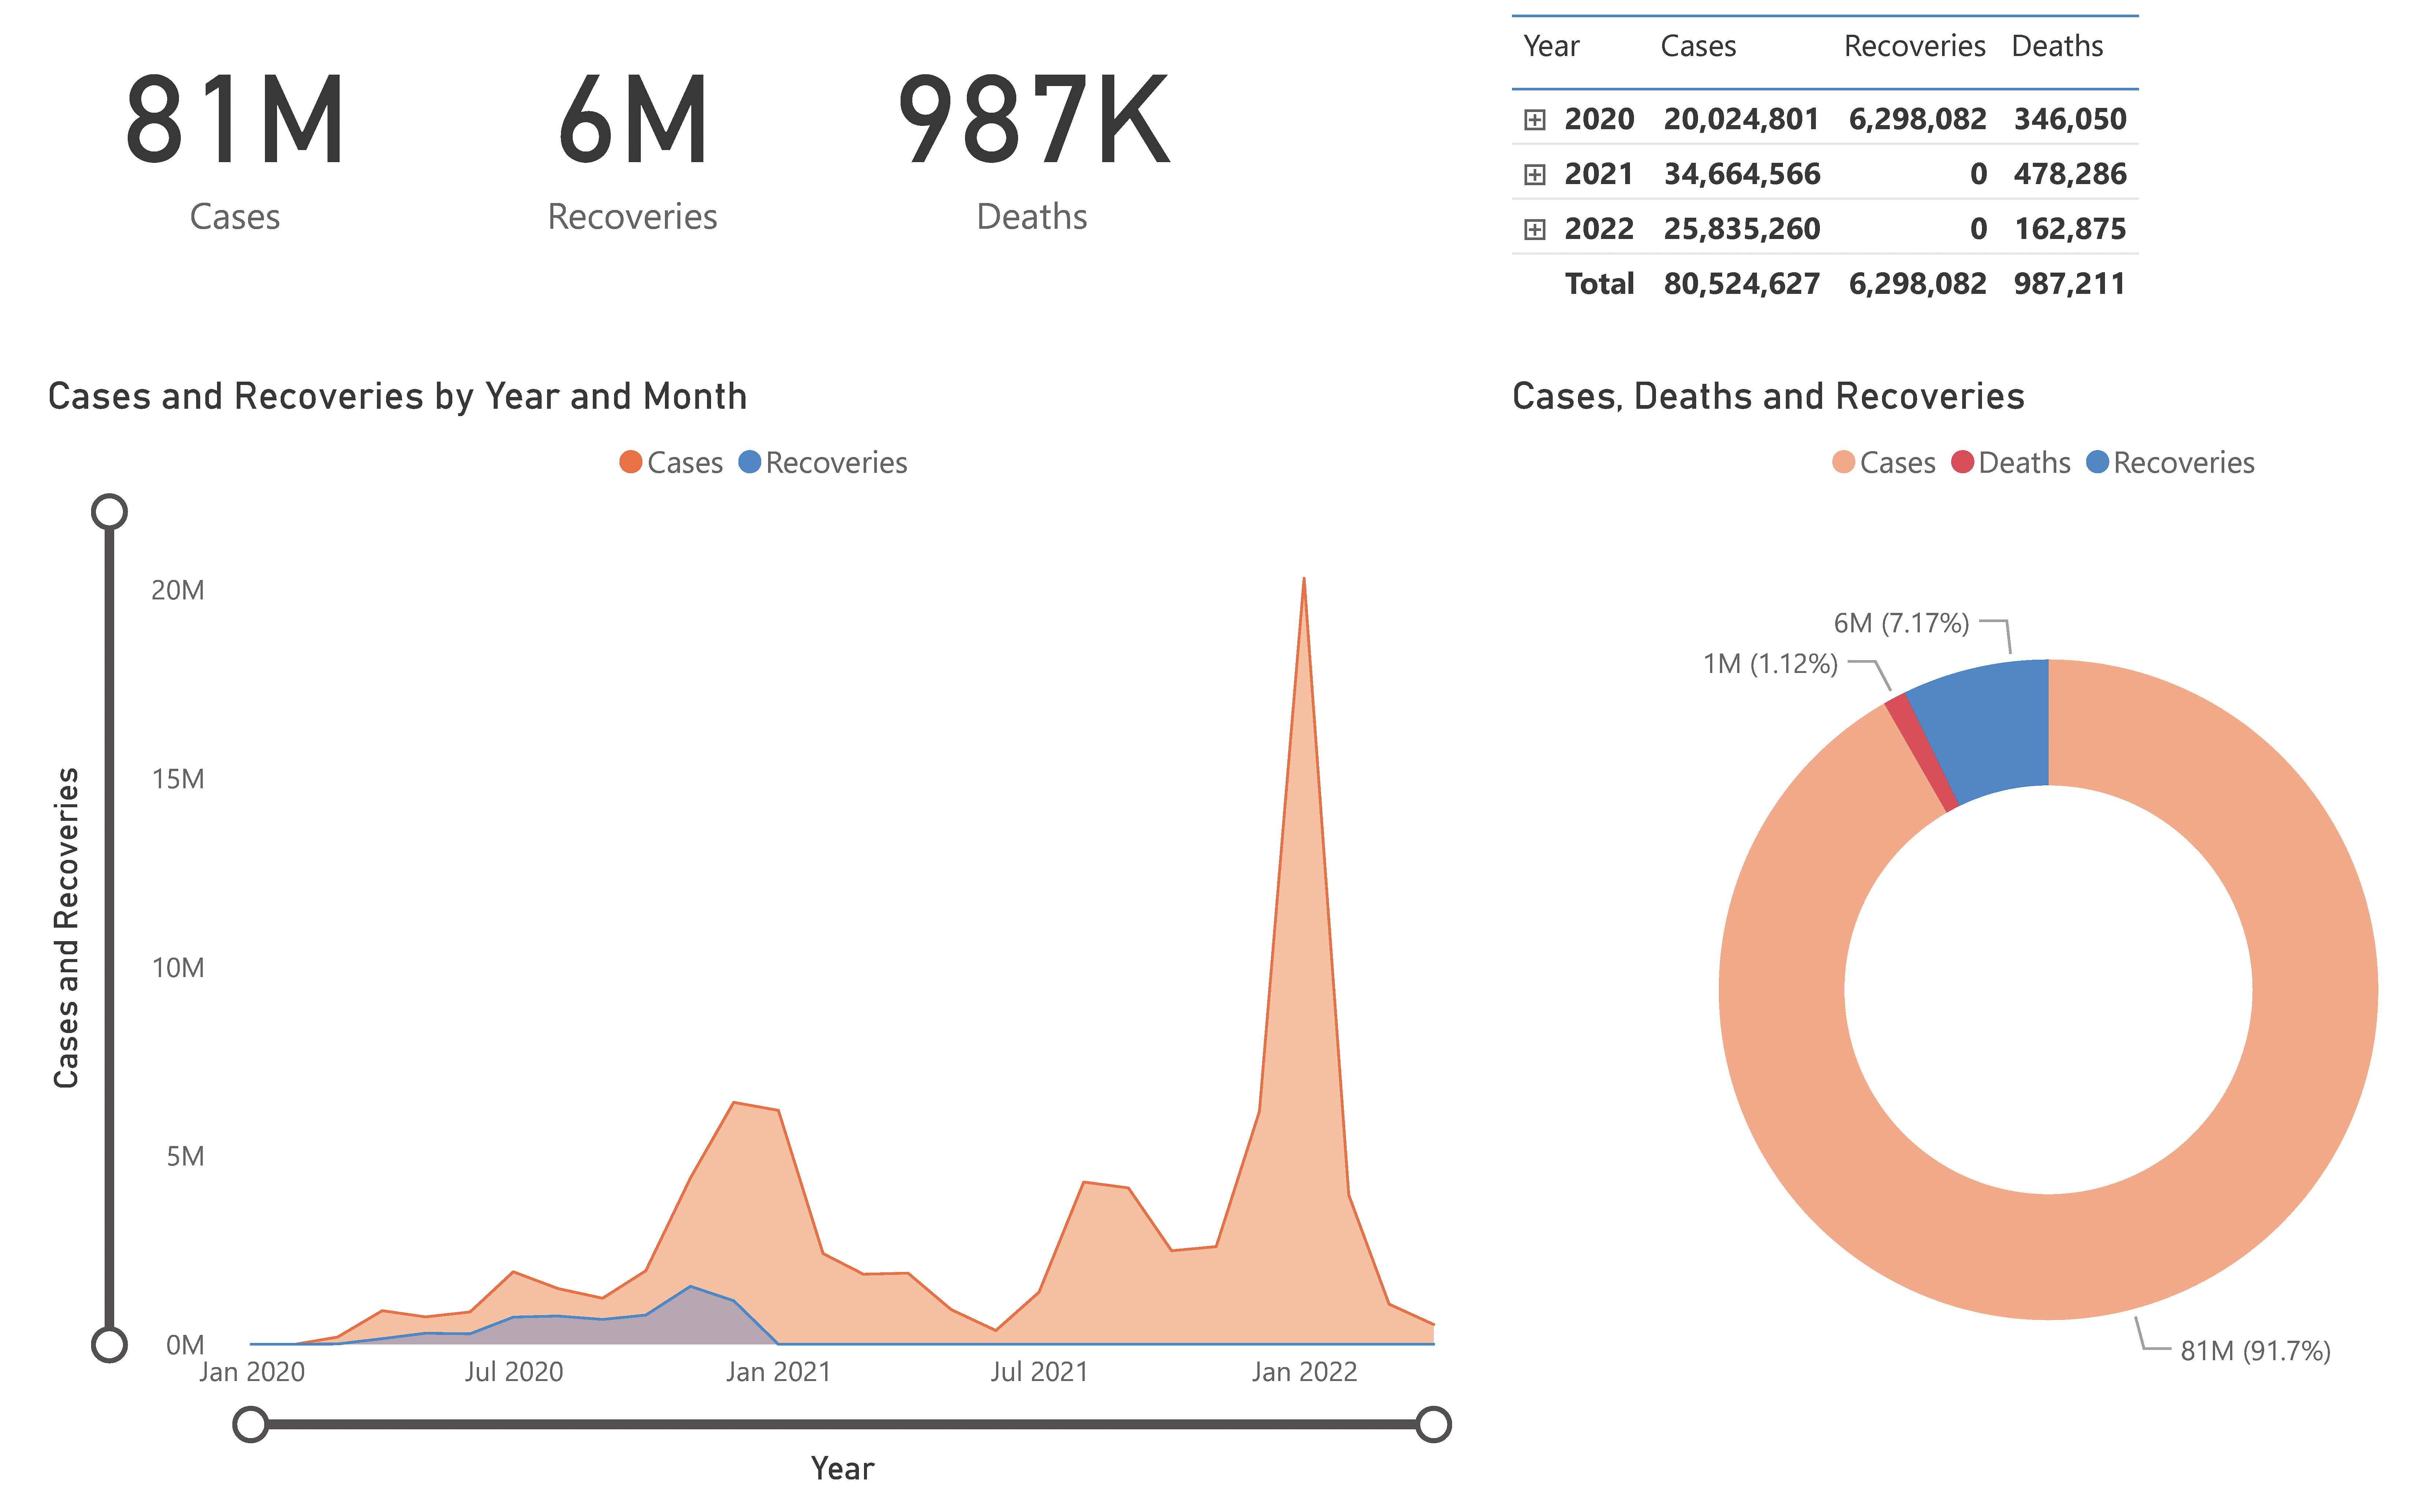
There is no one specific way to configure your dashboard. Just ensure that it displays the number of cases, recoveries, and deaths. I was more interested in the ETL part of this challenge than anything else. Feel free to tweak your dash to give it the look you want.
It's worth mentioning that the data from Johns Hopkins stopped including recoveries in December 2020. The reason the recovery line appears flat afterwards is because of this.
Final Thoughts
I had a fun time writing the Python code and using Lambda layers for this challenge. Thank you, Forrest, for continuing to provide these great challenges!
In the future, I plan on substituting my Lambda function for AWS Glue. For those who don't know, Glue is a serverless data integration service that allows users to more easily discover, prepare, move, and integrate data from multiple sources for analytics, machine learning (ML), and application development. Since we are no longer tracking recovered cases, my next report will just include case/death numbers.

